This system is a client-facing analytical tool used for browsing ATC’s historical database of incident reports, investigating interesting trends and patterns in activity and producing detailed graphs, charts and heat maps. Analytical graphics produced by the platform can be used to enhance the quality of briefing slides and assessments.


Each event recorded on the platform is categorized with up to 20 data points defining its date; location; context; Types and Sub-Types of Incident, Instigator and Target; and more. Each country database has been structured to be interoperable with the others, while maintaining country-specific nuance in the categorization of the data.
The platform can be used for:


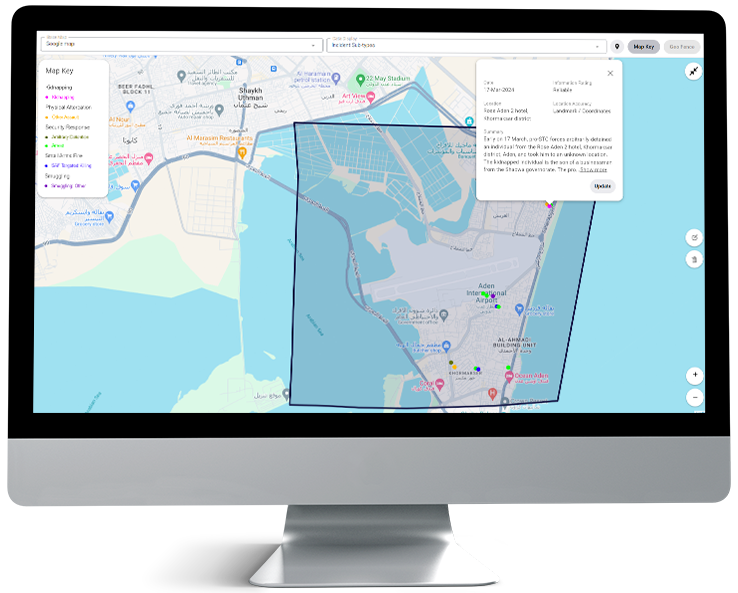
Investigating incident activity in any area of interest, whether at the country-level, in a specific province or neighborhood, or in the close proximity of your site via the geofence function.
The geofence function is also useful to investigate cross-border activity and conduct route assessments.
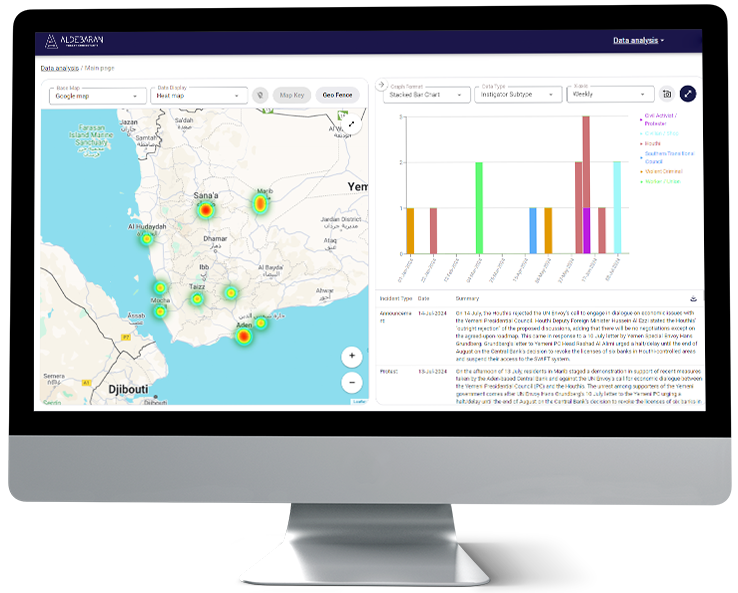
Identifying trends and patterns in incident activity, and investigating topics of interests including Crime, Civil Unrest, Terrorism, Military Conflict.
Aldebaran can customize searches on the Platform based on user-specific requirements, for users to always have timely data on specific topics or areas of interest.
Producing detailed graphs, charts and maps to support decision-making and to brief Executives or team members deploying on the ground after a rotation.
Isolate data of interest and visualize maps and incident reports (Incidents targeting Humanitarian NGOs in Yemen, data broken down by Instigator, 1 January – 17 July 2024)
Investigate incident activity in areas of interest (Crime-related incidents near Aden International Airport,
1 January – 17 July 2024).
ATC’s integrated suite of services excels in detailed reporting and advanced analytics, transforming intelligence into actionable insights.